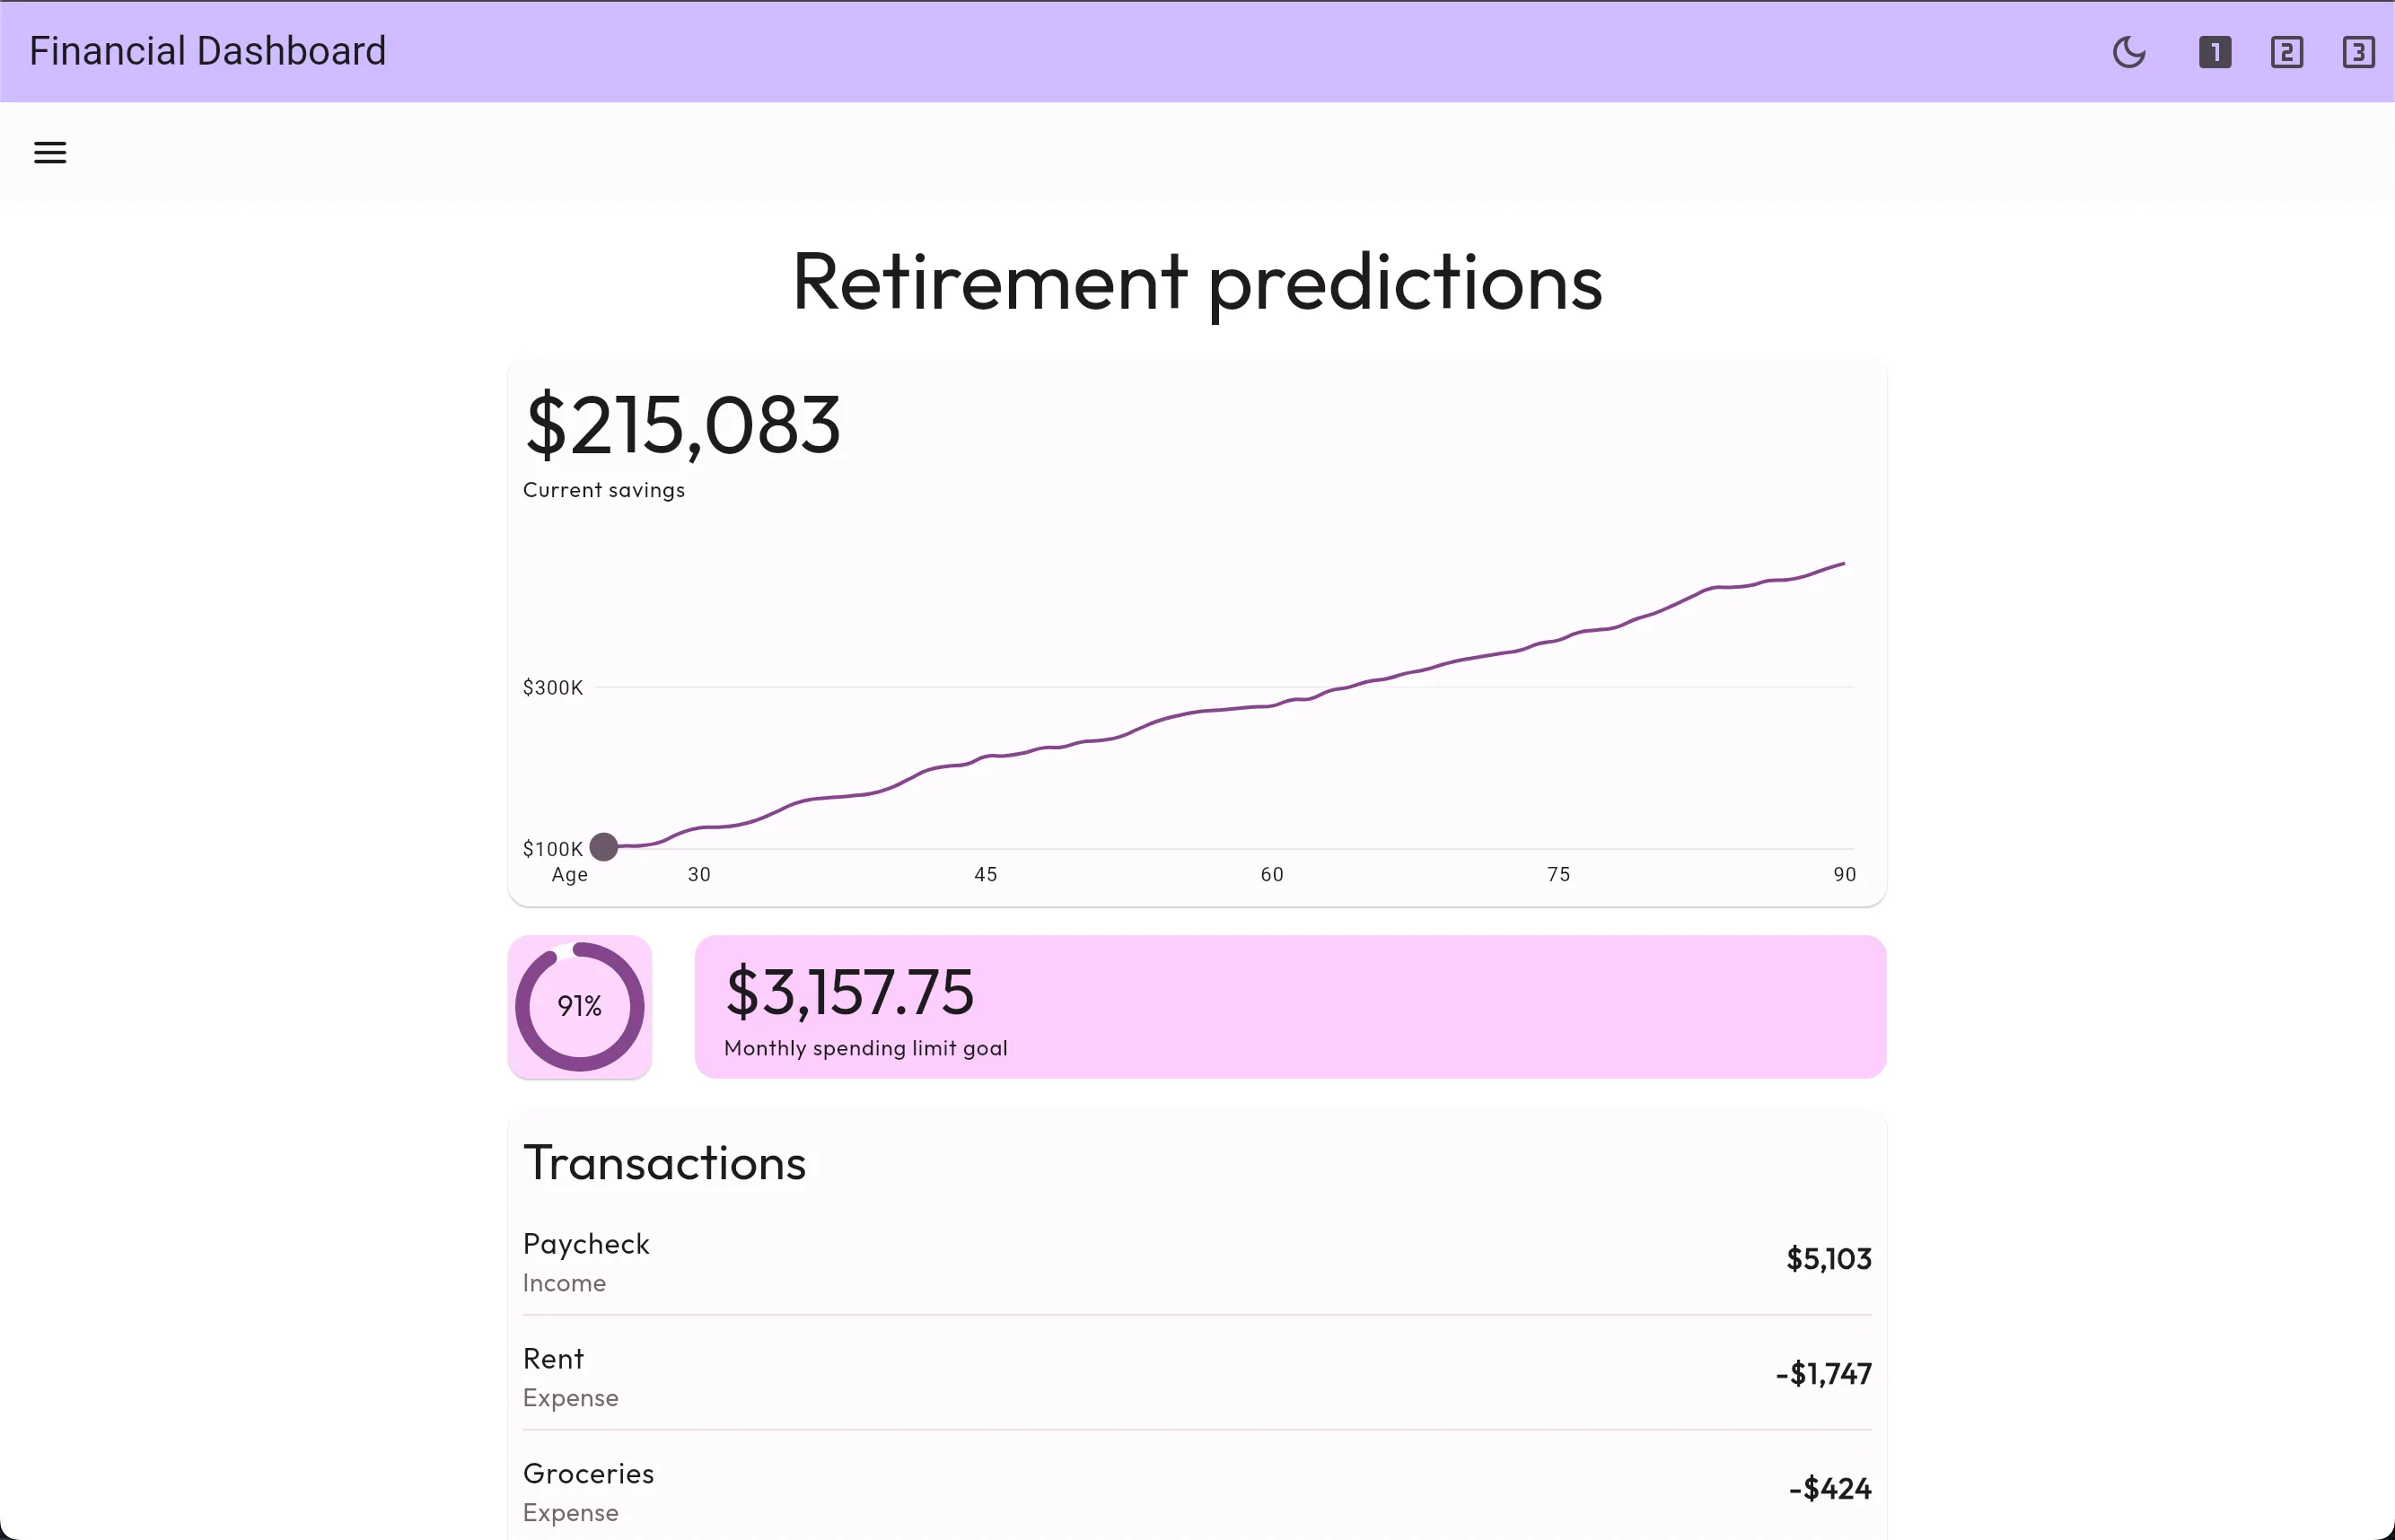
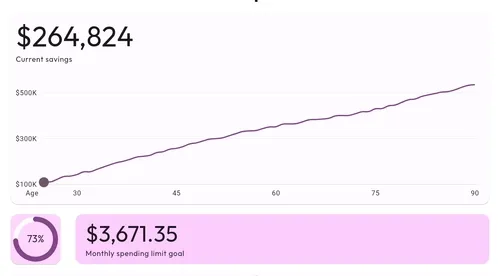
Financial Dashboard
The Financial Dashboard simulates a budgeting app with mocked data that showcases different themes, interactive graphs and UI animations when updating the data.

The source code for this project is available on GitHub. To view the live demo, click here.
Architecture
The Financial Dashboard is a simple demo managed by two state handlers, a Flavor Cubit to control which theme is shown, and a Financial Data Bloc that is responsible for generating random financial data. We will take a look into how both work together to update the theme and the data.
Theming
The theme in the app consists of a new color palette and a different widget layout. With this in mind, we cannot just update the ThemeData in the MaterialApp widget, but we handle the feature with a FlavorCubit.
It is a simple cubit that emits the selected flavor when the corresponding button is tapped.
class FlavorCubit extends Cubit<AppFlavor> {  FlavorCubit() : super(AppFlavor.one);
  void select(AppFlavor flavor) => emit(flavor);}
And rebuilds the appropriate page with a BlocBuilder.
BlocBuilder<FlavorCubit, AppFlavor>( builder: (context, state) { return switch (state) { AppFlavor.one => DeviceFrame( lightTheme: const FlavorOneTheme().themeData, darkTheme: const FlavorOneDarkTheme().themeData, child: const AppOne(), ), AppFlavor.two => DeviceFrame( lightTheme: const FlavorTwoTheme().themeData, darkTheme: const FlavorTwoDarkTheme().themeData, child: const AppTwo(), ), AppFlavor.three => DeviceFrame( lightTheme: const FlavorThreeTheme().themeData, darkTheme: const FlavorThreeDarkTheme().themeData, child: const AppThree(), ), }; },)Financial Data
The example data in the app is randomized on launch and every time the user pulls to refresh. This is handled by a FinancialDataBloc that creates random data with a set of constraints.
In addition, when generating new data, the text and the graphs are animated.

To achieve this, we divided each piece of data in a different widget so it can be reused. For each widget that needs animation, we defined both a controller and an animation. To make the first animation when the widget is loaded, we set the controller and run it in the initState.
  late AnimationController _controller;  late Animation<double> _animation;
  @override  void initState() {    super.initState();
    _controller = AnimationController(      duration: const Duration(seconds: 1),      vsync: this,    );
    final state = context.read<FinancialDataBloc>().state;    _animation = Tween<double>(begin: 0, end: state.currentSavings).animate(      _controller,    );    _controller.forward();  }
But that wouldn’t be sufficient if we also want to animate the data when the user pulls to refresh. To power that feature, we used a BlocListener that waits for a change in the corresponding data to reset and run the animation controller again.
BlocListener<FinancialDataBloc, FinancialDataState>( listenWhen: (previous, current) => previous.currentSavings != current.currentSavings, listener: (context, state) { _animation = Tween<double>(begin: 0, end: state.currentSavings).animate( _controller, ); _controller ..reset() ..forward(); }, child: ...,)